
Quantile คืออะไร
ในสถิติศาสตร์ ควอนไทล์ (quantile) คือค่าที่แบ่งข้อมูลออกเป็นส่วนเท่าๆ กัน โดยแต่ละส่วนจะมีจำนวนข้อมูลเท่ากันหรือใกล้เคียงกัน ควอนไทล์มีหลายชนิด ขึ้นอยู่กับจำนวนส่วนที่ต้องการแบ่งข้อมูล เช่น ควอร์ไทล์ (quartile) แบ่งข้อมูลออกเป็น 4 ส่วน เดไซล์ (decile) แบ่งข้อมูลออกเป็น 10 ส่วน และเปอร์เซนไทล์ (percentile) แบ่งข้อมูลออกเป็น 100 ส่วน
ประเภทของควอนไทล์
ควอนไทล์สามารถแบ่งออกเป็นประเภทต่างๆ ตามจำนวนส่วนที่ต้องการแบ่งข้อมูล ดังนี้
- ควอร์ไทล์ (quartile) แบ่งข้อมูลออกเป็น 4 ส่วนเท่าๆ กัน โดยเรียกควอนไทล์แต่ละส่วนว่า ควอร์ไทล์ที่ 1 (Q1), ควอร์ไทล์ที่ 2 (Q2), ควอร์ไทล์ที่ 3 (Q3) และควอร์ไทล์ที่ 4 (Q4)
- เดไซล์ (decile) แบ่งข้อมูลออกเป็น 10 ส่วนเท่าๆ กัน โดยเรียกควอนไทล์แต่ละส่วนว่า เดไซล์ที่ 1 (D1), เดไซล์ที่ 2 (D2), เดไซล์ที่ 3 (D3) และอื่นๆ ต่อไป
- เปอร์เซนไทล์ (percentile) แบ่งข้อมูลออกเป็น 100 ส่วนเท่าๆ กัน โดยเรียกควอนไทล์แต่ละส่วนว่า เปอร์เซนไทล์ที่ 1 (P1), เปอร์เซนไทล์ที่ 2 (P2), เปอร์เซนไทล์ที่ 3 (P3) และอื่นๆ ต่อไป
วิธีคำนวณควอนไทล์
ควอนไทล์สามารถคำนวณได้หลายวิธี ขึ้นอยู่กับประเภทของควอนไทล์ที่ต้องการคำนวณ ดังนี้
- ควอร์ไทล์ คำนวณได้โดยเรียงข้อมูลจากน้อยไปมาก จากนั้นหาค่าที่แบ่งข้อมูลออกเป็น 4 ส่วนเท่าๆ กัน โดยควอร์ไทล์ที่ 1 (Q1) คือค่าที่แบ่งข้อมูลออกเป็น 2 ส่วนเท่าๆ กัน ส่วนควอร์ไทล์ที่ 2 (Q2) คือค่ามัธยฐานของข้อมูล ส่วนควอร์ไทล์ที่ 3 (Q3) คือค่าที่แบ่งข้อมูลออกเป็น 3 ส่วนเท่าๆ กัน ส่วนควอร์ไทล์ที่ 4 (Q4) คือค่าที่แบ่งข้อมูลออกเป็น 4 ส่วนเท่าๆ กัน
- เดไซล์ คำนวณได้โดยเรียงข้อมูลจากน้อยไปมาก จากนั้นหาค่าที่แบ่งข้อมูลออกเป็น 10 ส่วนเท่าๆ กัน โดยเดไซล์ที่ 1 (D1) คือค่าที่แบ่งข้อมูลออกเป็น 2 ส่วนเท่าๆ กัน ส่วนเดไซล์ที่ 2 (D2) คือค่าที่แบ่งข้อมูลออกเป็น 3 ส่วนเท่าๆ กัน ส่วนเดไซล์ที่ 3 (D3) คือค่าที่แบ่งข้อมูลออกเป็น 4 ส่วนเท่าๆ กัน และอื่นๆ ต่อไป
- เปอร์เซนไทล์ คำนวณได้โดยเรียงข้อมูลจากน้อยไปมาก จากนั้นหาค่าที่แบ่งข้อมูลออกเป็น 100 ส่วนเท่าๆ กัน โดยเปอร์เซนไทล์ที่ 1 (P1) คือค่าที่แบ่งข้อมูลออกเป็น 2 ส่วนเท่าๆ กัน ส่วนเปอร์เซนไทล์ที่ 2 (P2) คือค่าที่แบ่งข้อมูลออกเป็น 3 ส่วนเท่าๆ กัน ส่วนเปอร์เซนไทล์ที่ 3 (P3) คือค่าที่แบ่งข้อมูลออกเป็น 4 ส่วนเท่าๆ กัน และอื่นๆ ต่อไป
ตัวอย่างการคำนวณควอนไทล์
สมมติเรามีข้อมูลดังนี้
1, 2, 3, 4, 5, 6, 7, 8, 9, 10 ค่าควอร์ไทล์ที่ 1 (Q1) ของข้อมูลนี้คือ 4 เนื่องจากเป็นค่าที่แบ่งข้อมูลออกเป็น 2 ส่วนเท่าๆ กัน โดยมีค่า 1 และ 2 อยู่ด้านล่าง และค่า 3, 4, 5, 6, 7, 8, 9, 10 อยู่ด้านบน
ค่าควอร์ไทล์ที่ 2 (Q2) ของข้อมูลนี้คือ 6 เนื่องจากเป็นค่ามัธยฐานของข้อมูล
ค่าควอร์ไทล์ที่ 3 (Q3) ของข้อมูลนี้คือ 8 เนื่องจากเป็นค่าที่แบ่งข้อมูลออกเป็น 3 ส่วนเท่าๆ กัน โดยมีค่า 1, 2, 3, 4 อยู่ด้านล่าง และค่า 5, 6, 7, 8, 9, 10 อยู่ด้านบน
ประโยชน์ของควอนไทล์
ควอนไทล์มีประโยชน์ในหลายด้าน เช่น
- การเปรียบเทียบข้อมูล ควอนไทล์สามารถใช้เปรียบเทียบข้อมูลชุดต่างๆ กัน เพื่อดูว่าข้อมูลชุดใดมีแนวโน้มเป็นอย่างไร
- **การระบุจุดเด่น
Webโดยที่ Q p คือค่าของ p-quantile สำหรับ 0 < p < 1 (หรือเทียบเท่ากับ k-th q-quantile สำหรับ p = k / q) โดยที่ μ คือค่าเฉลี่ยเลขคณิตของการแจกแจง และโดยที่ σ คือ … Webโดยที่Q 1 และQ 3 เป็นควอร์ไทล์ที่หนึ่งและสามตามลำดับ รั้วด้านล่างคือ "ขีดจำกัดล่าง" และรั้วบนคือ "ขีดจำกัดบน" ของข้อมูล และข้อมูลใดๆ ที่อยู่นอก … Webในสถิติและความน่าจะเป็น ควอนไทล์เป็นจุดตัดที่แบ่งช่วงของ … WebWe plot these data in a scatterplot, known as a quantile-quantile plot or q-q plot. If the resulting scatterplot is roughly linear, then the model is a good fit for our data.. Webควอร์ไทล์. ควอร์ไทล์คืออะไรเป็นการบอกตำแหน่งของมูลโดยการนำข้อมูลมาเรียงจากน้อยไปหามากก่อน. WebSandbagging แปลว่าอะไร? [What a Word!] Sandbagging ไม่ได้แปลว่า ถุงทรายที่เราใช้กั้นน้ำเวลาน้ำท่วมเพียงอย่างเดียว จริงๆ แล้วคำนี้ยังมีความหมายอื่นๆ อีกด้วยและ …
Quantile Quantile plots – GeeksforGeeks – Source: www.geeksforgeeks.org

Quantile – Quantile plot in R or QQ Plot in R – DataScience Made Simple – Source: www.datasciencemadesimple.com

Beginners Guide to R – R Quantile-Quantile (QQ) Plot – Base Graph – Source: setscholars.net

The Basics of Quantile Regression – Aptech – Source: www.aptech.com

splines – Quantile curves (strange results at 0.975 quantile) – Cross – Source: stats.stackexchange.com

Quantile-Quantile plots of the different reference standards. (a-d – Source: www.researchgate.net

Elementary Statistics with R – Source: homerhanumat.github.io

PPT – Introduction to Quantile Regression PowerPoint Presentation, free – Source: www.slideserve.com

Quantile-normalize intensity measurements – Source: jdblischak.github.io

Quantile Regression • Zelig – Source: docs.zeligproject.org
Quantile คือ อะไร, Quantile-Quantile Plots (QQ plots), Clearly Explained!!!, 9.52 MB, 06:56, 443,767, StatQuest with Josh Starmer, 2017-11-13T13:09:12.000000Z, 9, Quantile Quantile plots – GeeksforGeeks, 1524 x 836, png, quantile plots geeksforgeeks, 10, quantile-%e0%b8%84%e0%b8%b7%e0%b8%ad-%e0%b8%ad%e0%b8%b0%e0%b9%84%e0%b8%a3
Quantile คือ อะไร. Webสถิติสรุปเช่นค่ามัธยฐาน ควอร์ไทล์ที่หนึ่งและควอร์ไทล์ที่สาม คือการวัดตำแหน่ง เนื่องจากตัวเลขเหล่านี้ระบุว่ามีสัดส่วนการกระจายข้อมูล …
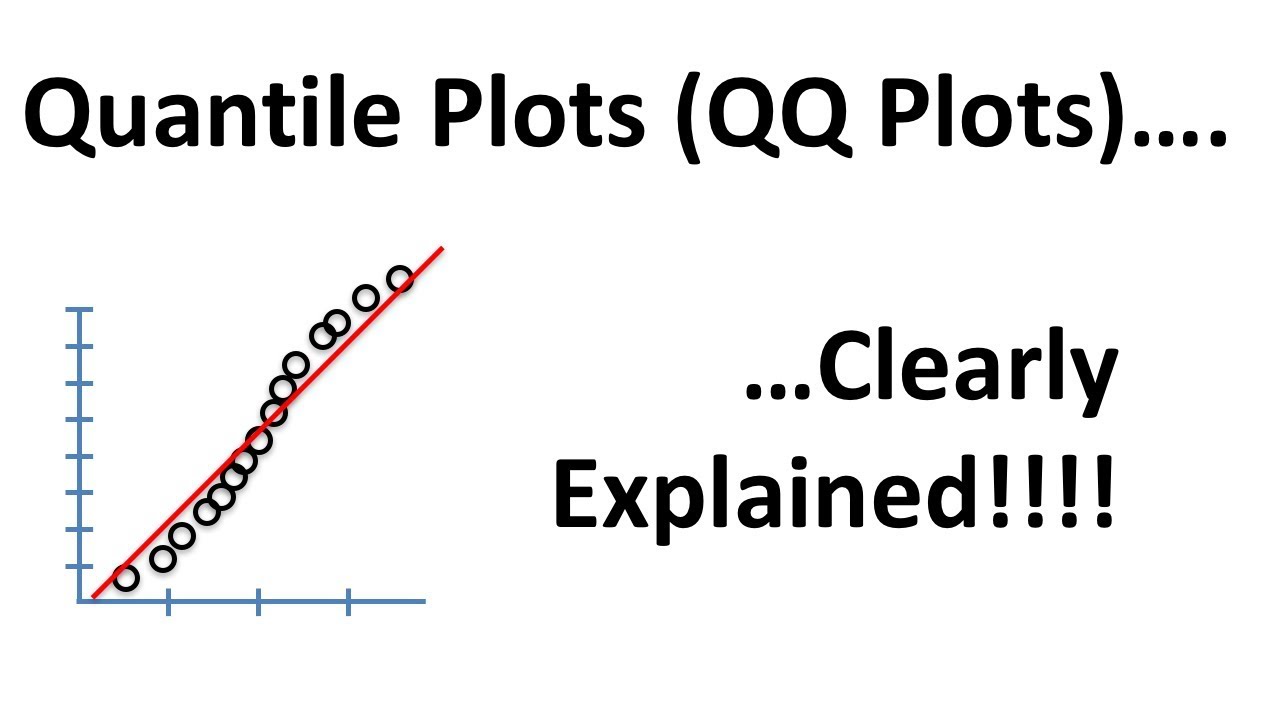
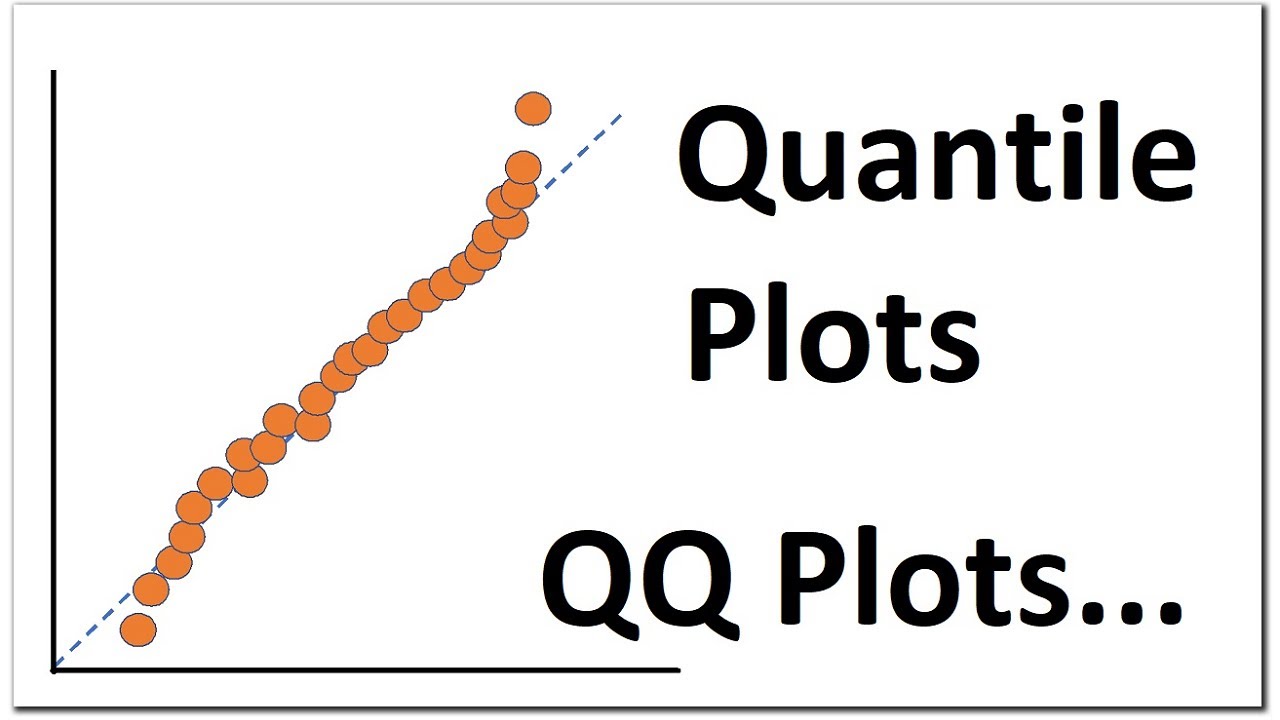
Quantile-Quantile (QQ) plots are used to determine if data can be approximated by a statistical distribution. For example, you might collect some data and wonder if it is normally distributed. A QQ plot will help you answer that question. You can also use QQ plots to compare to different datasets that you collected to determine if their distributions are comparable. This video shows you how to do both things.
NOTE: The data in this video are measures of gene expression. If “gene expression” doesn’t mean anything to you, just imagine that the data represents how tall a bunch of people are, or how much they weigh. Then consider the y-axis to be the height or weight of the people, and the x-axis just represents all of the data you collected on a single day. In this case, all of the data were collected on the same day, so they form a single column.
For a complete index of all the StatQuest videos, check out:
statquest.org/video-index/
If you’d like to support StatQuest, please consider…
Buying The StatQuest Illustrated Guide to Machine Learning!!!
PDF – statquest.gumroad.com/l/wvtmc
Paperback – amazon.com/dp/B09ZCKR4H6
Kindle eBook – amazon.com/dp/B09ZG79HXC
Patreon: patreon.com/statquest
…or…
YouTube Membership: youtube.com/channel/UCtYLUTtgS3k1Fg4y5tAhLbw/join
…a cool StatQuest t-shirt or sweatshirt:
shop.spreadshirt.com/statquest-with-josh-starmer/
…buying one or two of my songs (or go large and get a whole album!)
joshuastarmer.bandcamp.com/
…or just donating to StatQuest!
paypal.me/statquest
Lastly, if you want to keep up with me as I research and create new StatQuests, follow me on twitter:
twitter.com/joshuastarmer
Corrections:
4:35 The Uniform Distribution has one extra quantile
5:30 I should have said that Quartiles divide the data into 4 parts.
#statquest #quantile #qqplot
Quantile Quantile plots – GeeksforGeeks
Quantile คือ อะไร, WebWe plot these data in a scatterplot, known as a quantile-quantile plot or q-q plot. If the resulting scatterplot is roughly linear, then the model is a good fit for our data.. Webควอร์ไทล์. ควอร์ไทล์คืออะไรเป็นการบอกตำแหน่งของมูลโดยการนำข้อมูลมาเรียงจากน้อยไปหามากก่อน. WebSandbagging แปลว่าอะไร? [What a Word!] Sandbagging ไม่ได้แปลว่า ถุงทรายที่เราใช้กั้นน้ำเวลาน้ำท่วมเพียงอย่างเดียว จริงๆ แล้วคำนี้ยังมีความหมายอื่นๆ อีกด้วยและ …
Quantile-Quantile Plots (QQ plots), Clearly Explained!!!
Source: Youtube.com
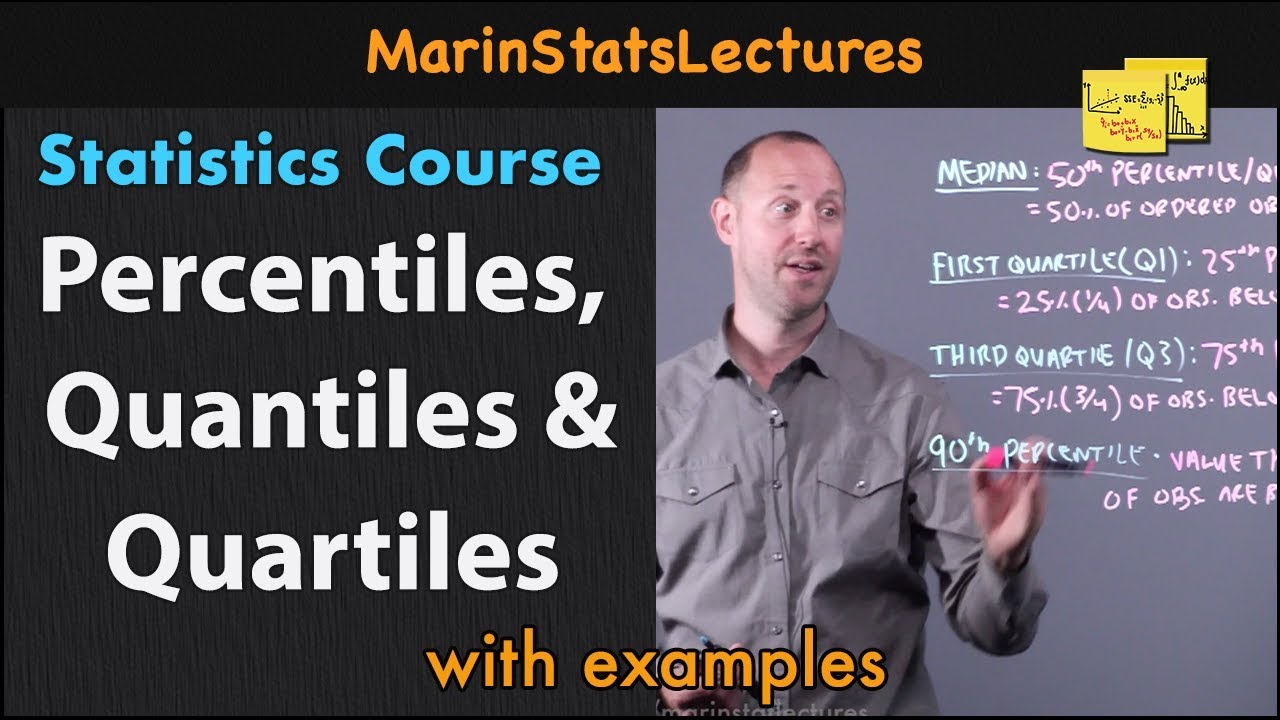
Percentiles, Quantiles and Quartiles in Statistics | Statistics Tutorial | MarinStatsLectures
Source: Youtube.com
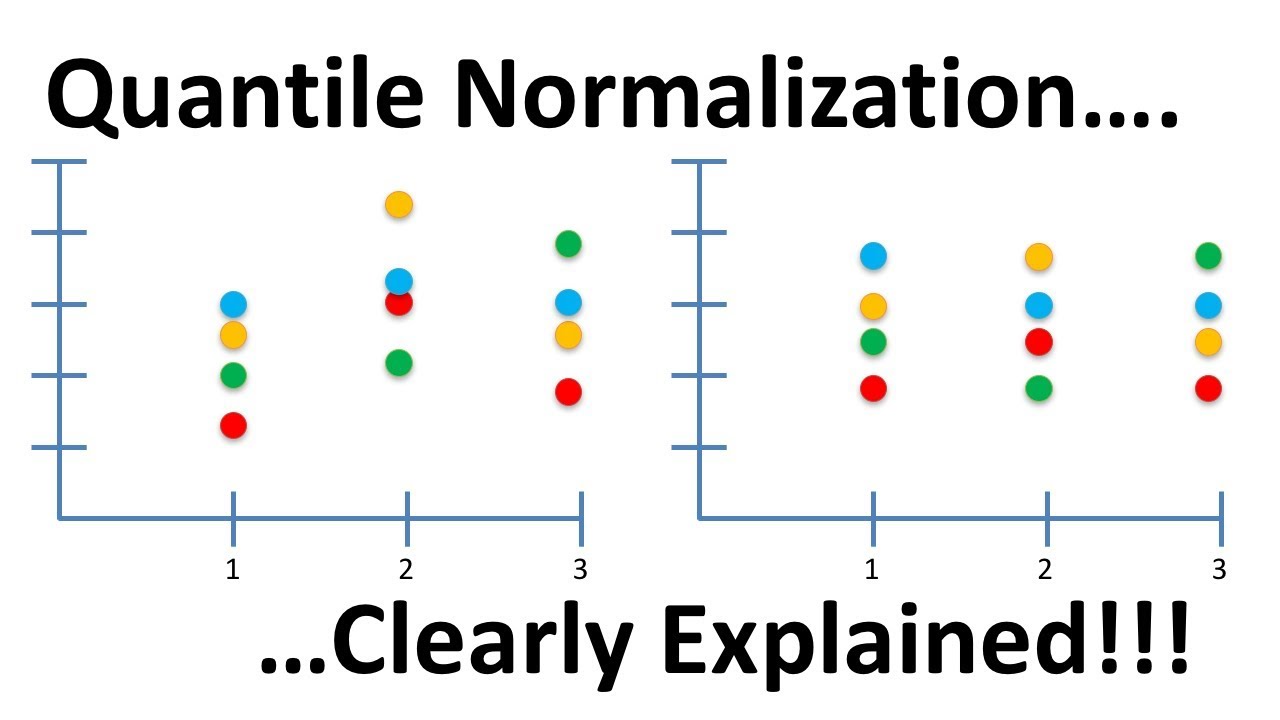
Quantile Normalization, Clearly Explained!!!
Source: Youtube.com
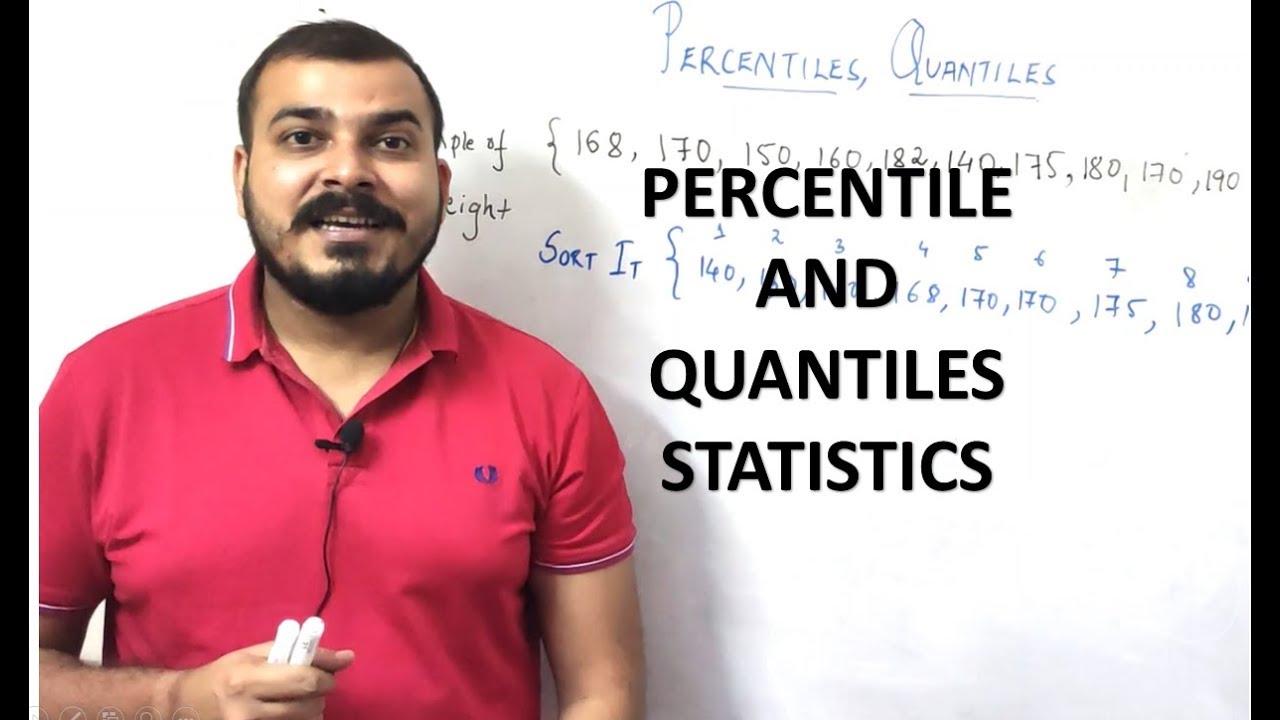
STATISTICS- PERCENTILES and QUANTILES
Source: Youtube.com
Quantile Regression as The Most Useful Alternative for Ordinary Linear Regression
Source: Youtube.com
#10: Scikit-learn 7: Preprocessing 7: Intuition for Quantile Transform

Source: Youtube.com
FRM: Quantile function (Inverse CDF)

Source: Youtube.com
QQ plots (Quantile-Quantile Plots) | Explained in simple steps
Source: Youtube.com
Percentiles (Centiles, Percentile Rank), Deciles and Quartiles Defined & Explained in One Minute

Source: Youtube.com
ด้านล่างนี้คือรายการเหล่านี้: ควอนไทล์ 2 ตัวเรียกว่าค่ามัธยฐาน , แน่นอนควอนไทล์อื่น ๆ มีอยู่นอกเหนือจากรายการด้านบน · หลายครั้งที่ quantile … .
สรุปเนื้อหา ควอร์ไทล์ จากบทเรียน สถิติ คณิตศาสตร์ ม. ปลาย .
พจนานุกรม แปลภาษา แปลภาษาอังกฤษ แปลความหมาย Longdo Dictionary English Japanese German French Dictionary Service .
[พบคำตอบแล้ว!] 0 ควอไทล์ = 0 ควอไทล์ = 0 เปอร์เซ็นต์ไทล์ 1 ควอไทล์ = 0.25 ควอไทล์ = 25 เปอร์เซ็นต์ไทล์… .
ในทางสถิติศาสตร์ และความน่าจะเป็น ควอนไทล์ (อังกฤษ: quantile) คือจุดตัดแบ่งพิสัยของการแจกแจงความน่าจะเป็นเป็, .
.
ควอร์ไทล์ (Quartile), ควินไทล์ (Quintile), ควอนไทล์ (Quantile) สามคำที่สับสนในสถิติศาสตร์ ผู้ช่วยศาสตราจารย์ ดร.อานนท์ ศักดิ์, .
อยากรู้ ความหมายของ เปอร์เซ็นไทล์ ควอไทล์ และเดไซ ทั้งจัดกลุ่มและไม่จัดกลุ่ม ค่ะ ขอบคุณค่ะ .
.
เมื่อคำนามความแตกต่างระหว่าง fractile และ quantile คือ fractile คือ (สถิติ) มูลค่าของการแจกแจงที่เศษส่วนของตัวอย่างบางส่, .
“,หนังสือที่ให้ความรู้เพื่อให้ผู้ศรัทธาในศาสนา · “…หนังสือเล่มนี้ให้ความรู้เกี่ยวกับคุณค่าของเดือ .
ศูนย์วัคซีน สมิติเวช ไชน่าทาวน์ · สถาบันสุขภาพผิวพรรณ สมิติเวช .
Chiang Mai University Journal of Economics (CMJE) is a double-blind peer-reviewed journal published by the Faculty of Economics, Chiang Mai University, Thailand which aims to be a channel to report academic progression in the field of economics. It was established in 1996 and has been indexed , .
อาจารย์ ดร. อานนท์ ศักดิ์วรวิชญ์ สาขาวิชา Business Analytics and Intelligence สาขาวิชาวิทยาการประกันภัยและการบริหารความเสี่ยง , .
ความแตกต่างที่สำคัญระหว่าง Quantile และ Quartile คือไฟล์ Quantile คือจุดตัดที่แบ่งชุดการสังเกตออกเป็นกลุ่มขนาดเท่า ๆ กัน , .
เราสามารถสร,ได้คือจำนวนธรรมชาติ n เราจะแบ่งการกระจายของตัวแปรลงได้อย่างไร n ชิ้นเท่า ๆ กัน? นี้พูดโดยตรงกับความคิดของ quantiles… .
มีทุกเรื่องให้อ่านครับ ลองค้นหาดู ฝากแชร์ ให้เพื่อนๆดูด้วยคับ · ควอร์ไทล์คืออะไรเป็นการบอกตำแหน่งของม, .
ส่วนกลาง / ภูมิภาค · ส่วนกลาง กรุงเทพฯ .
ดังนั้น 4-quantiles ,สี่คือ 20 · พิจารณาประชากรที่เรียงลำดับจากค่าข้อมูล 11 ค่า {3, 6, 7, 8, 8, 9, 10, 13, 15, 16, 20} 4 ควอไทล์ (“ควอร์ไทล์”) ของชุดข้อมูลนี้มีอะไรบ้าง · ดังนั้น 4-quantiles … .
